This section covers calculations in pivot tables, including setting the display of total rows/columns, field consolidation methods, and data display methods.
Setting Display of Total Rows and Columns
Use the RowGrand and ColumnGrand properties of the PivotTable object to show or hide total rows and columns.
[Excel VBA] The sample file path is Samples\ch19\Excel VBA\ Setting the Display of Total Rows and Columns.xlsm. Run the CreatePVT procedure to generate the pivot table. The RowColumnGrand procedure hides the total rows and columns.
Sub RowColumnGrand()
    ' Omitted: get pivot table pvt
    ' ...
    pvt.RowGrand = False
    pvt.ColumnGrand = False
End Sub
Running the procedure generates the pivot table shown in Figure 7-13.
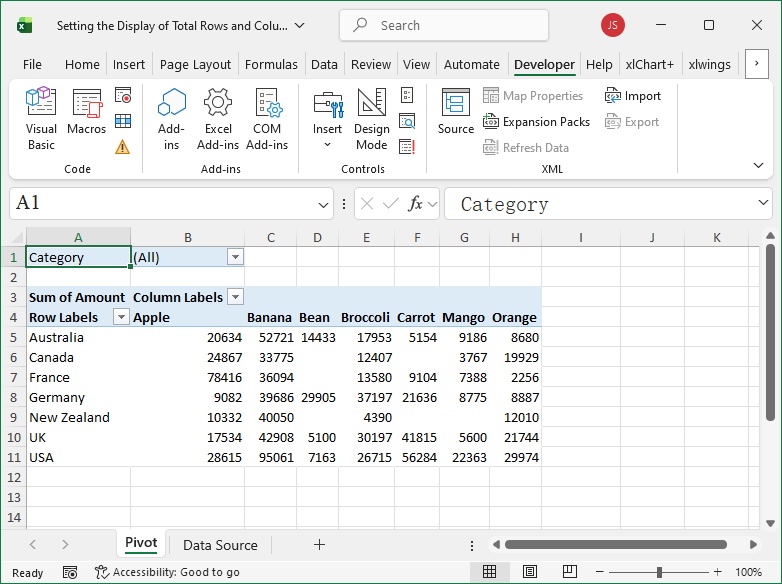
Figure 7-13
[Python] The Python script file path is Samples\ch19\Python\ Setting the Display of Total Rows and Columns.py.
(Omitted code for brevity; refer to the Python file.)
Set display of total rows and columns:
pvt.RowGrand = False
pvt.ColumnGrand = False
Running the script generates the pivot table shown in Figure 7-13.
Setting Field Consolidation Method
Use the Function property of the PivotField object to set the consolidation method of a field (default is sum).
[Excel VBA] The sample file path is Samples\ch19\Excel VBA\ Setting the Summary Function for a Field.xlsm. Run the CreatePVT procedure to generate the pivot table. The SetStyle procedure specifies counting for “sum:Amount”.
Sub SetStyle()
    ' Omitted: get pivot table pvt
    ' ...
    pvt.PivotFields("sum of Amount").Function = xlCount  ' Count consolidation
End Sub
Running the procedure generates the pivot table shown in Figure 7-14.
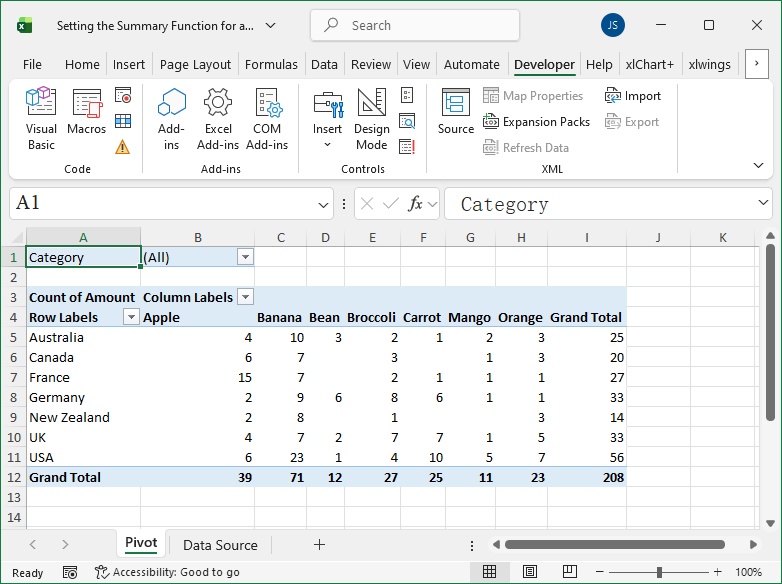
Figure 7-14
[Python] The Python script file path is Samples\ch19\Python\ Setting the Summary Function for a Field.py.
(Omitted code for brevity; refer to the Python file.)
Set field consolidation method:
pvt.PivotFields('sum:Amount').Function = \
    xw.constants.ConsolidationFunction.xlCount
Running the script generates the pivot table shown in Figure 7-14.
Setting Data Display Method
Use the Calculation property of the PivotField object to set the data display method in the pivot table.
[Excel VBA] The sample file path is Samples\ch19\Excel VBA\ Setting the Data Display Format.xlsm. Run the CreatePVT procedure to generate the pivot table. The SetFieldData procedure specifies displaying “sum:Amount” as row percentage (each data in a row is shown as a percentage of the row total).
Sub SetFieldData()
    ' Omitted: get pivot table pvt
    ' ...
    pvt.PivotFields("sum of Amount").Calculation = xlPercentOfRow
End Sub
Running the procedure generates the pivot table shown in Figure 7-15.
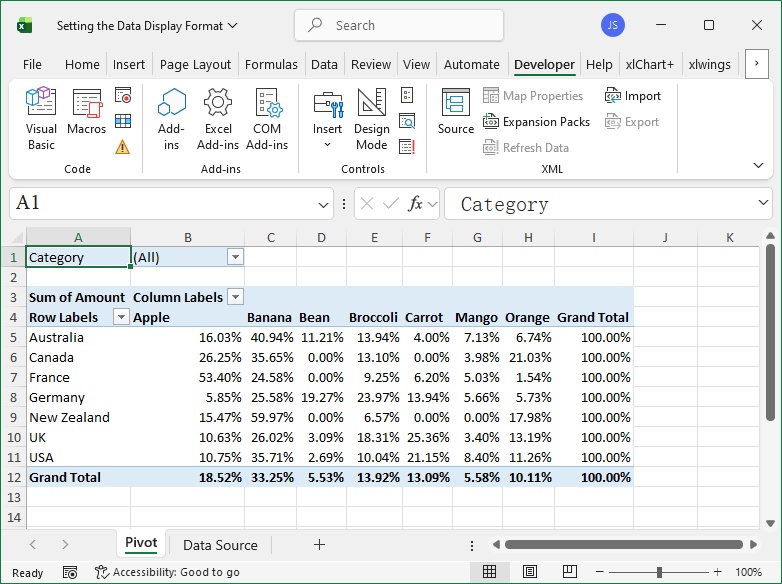
Figure 7-15
[Python] The Python script file path is Samples\ch19\Python\ Setting the Data Display Format.py.
(Omitted code for brevity; refer to the Python file.)
Set data display method:
pvt.PivotFields('sum:Amount').Calculation = \
    xw.constants.PivotFieldCalculation.xlPercentOfRow
Running the script generates the pivot table shown in Figure 7-15.